
Survey Academy
Standard deviation (represented by the symbol σ) shows how much variation or “dispersion” exists from the average (mean, or expected value).

σ – standard deviation, E(X) – expected value of X, X – random variable
Standard deviation gives us information how dispersed data (like age, inflation, market, share prices, …) is. A low value indicates that the data points tend to be very close to the mean, whereas a high value indicates that the data points are spread out over a large range of values.
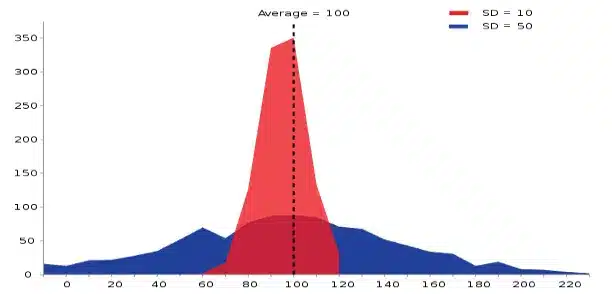
Example of two sample populations with the same mean and different standard deviations (red SD = 10; blue SD = 50).
Example
In order to better understand what is standard deviation and why it is important we prepared a short example.
Consider, that we examined two groups regarding their age. Age distribution in group A is 11, 15, 18, 20, 21, 24, 60, 71, 78, 82 and in group B is 36, 36, 37, 38, 39, 40, 41, 42, 44, 47. The average (mean) in both cases is equal to 40. Does it mean that both groups are identical? Is average enough to describe and compare both groups? The answer is NO.
Using only average one can get the wrong opinion that two groups are identical. In fact, differences are significant. The first group has big age differences. The second group is more homogenous and age of different people are similar.
Differences in each group can be more precisely described with standard deviation. In the case of group A standard deviation is equal to 27.5 and in case of group B 3.4.
Standard deviation gives us information if observations in the group are similar or different. The smaller the value the more similar observation and the bigger concentration around the average (mean). The bigger the value the bigger dispersion (differences between observations).